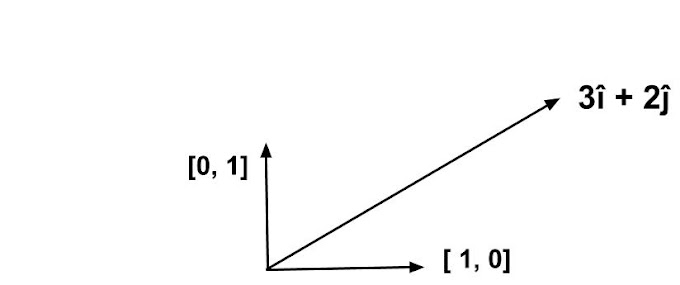
We all have studied Vectors at our high school but wait, ever you have used the concept of vectors in real life?
The formal definition most of us learned at our high school is that "A vector is a quantity which has both direction and magnitude". But what do we mean of it?
Vectors are the most important part of Linear Algebra. Linear Algebra is a concept in mathematics that revolves around the linear equations which in turn helps us to visualize shapes, lines, planes, and rotation of mathematical objects.
So in short, Linear Algebra is used to visualize the mathematical concepts.
Let's come back to vectors, Vectors are nothing but all the possible points in a vector space.
What do we mean by Vector Space?
Say you have a cartesian plane with X-axis and Y-axis, Then that cartesian plane will be your vector space, And any point (x,y) on that will be vector represented by [x, y].
The above image represents a cartesian plane with X-axis and Y-axis, That cartesian plane is our Vector space and the [4, 2] will be our vector represented with an arrow.
Now, the definition says that the vector has direction and magnitude. The direction is represented by the arrow but what about magnitude?
The magnitude of a vector is calculated by the formula = √ x2 + y2
Let's move to a real-world example for Vector Space, Suppose you are manufacturing a car then, The car will be your vector space and things such as color, cylinder size, co2 emissions, and other such things will be vectors and you can represent them as a list [ color, cylinder size, co2 emmission].
Now, the question arises that what is the role of vectors in machine learning?
In Machine Learning we work with Datasets. The Dataset is composed of features and instances, that is rows and column. In the dataset, we have numeric values or numeric data that allows doing mathematical calculations to develop the model or formula.For example, let's take a dataset
The above dataset is the dataset representing the price of land for a given square foot.
Now we have to develop the model or formula from this dataset so that it can predict the price for any square feet value.
Now as I said earlier that Linear Algebra allows us to visualize the problem, so we convert this dataset as if they are vectors i.e we have 7 Rows in this dataset and each row can be treated as a vector [x,y] and can be plotted in a vector space.
Thus we have 7 data- points to plot in a cartesian plane.
So, it is pretty clear that visualizing our dataset as a mathematical quantity or as a set of a vector will allow us to understand the pattern between price and square_feet columns, Moreover, we can apply certain properties of vectors such as Dot product, projection or Linear Transformation or Rotations to our dataset for further clarity.
Click here to read the next concept, Vector Properties, And Mathematical Foundation
In further posts, we will discuss the basic properties of a vector such as Dot product, projections, Linear Independent basis vectors, and other such topics to have neat knowledge to work with vectors.


Social Plugin